Customise Consent Preferences

We use cookies to help you navigate efficiently and perform certain functions. You will find detailed information about all cookies under each consent category below.

The cookies that are categorised as "Necessary" are stored on your browser as they are essential for enabling the basic functionalities of the site. ... 

Always Active

Necessary cookies are required to enable the basic features of this site, such as providing secure log-in or adjusting your consent preferences. These cookies do not store any personally identifiable data.

No cookies to display.

Functional cookies help perform certain functionalities like sharing the content of the website on social media platforms, collecting feedback, and other third-party features.

No cookies to display.

Analytical cookies are used to understand how visitors interact with the website. These cookies help provide information on metrics such as the number of visitors, bounce rate, traffic source, etc.

No cookies to display.

Performance cookies are used to understand and analyse the key performance indexes of the website which helps in delivering a better user experience for the visitors.

No cookies to display.

Advertisement cookies are used to provide visitors with customised advertisements based on the pages you visited previously and to analyse the effectiveness of the ad campaigns.

No cookies to display.

Delaget is now part of PAR Technology, read our exciting news here!

Search
Close this search box.
DELAGET LOGO0

Fill out the form to get the ebook

Public Resource Request Form

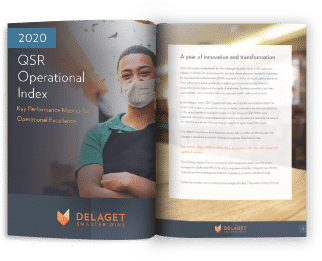
Download the 2020 QSR Operational Index and see how your restaurants compare

In 2020, the tried-and-true playbook went out the window for most QSR operators, as they faced new challenges in nearly every facet of their business, from employee retention to new delivery partners, modified menus and hours, and much more. And yet, the industry performed well overall. Clearly, there are lessons to be learned from 2020.

In the Delaget 2020 QSR Operational Index, we compiled and analyzed data from 6,000 QSR locations around the country to better understand the lasting implications of the global pandemic and what it means for the future of QSR.

Download the Index to get the scoop on how the industry performed across these operational metrics:

Sales

  • Revenue per store
  • Transactions per store
  • Guest check per store
  • Average sales by store size
  • Sales % by channel
  • Guest check by channel

Costs

  • Cost of goods sold (COGS)
  • Labor % of sales
  • Food and labor cost % of sales by store size
  • California-specific data

Employee trends

  • Employees per store
  • Hourly wage
  • Overtime hours per store
  • Turnover
  • California-specific data

Loss

  • Daily cash shortage
  • # Refunded transactions
  • # Cancelled transactions
  • Discount % of sales
  • Employee meals
  • Beverage % of sales
  • # Beverages per check

Customer experience

  • Customer satisfaction
  • Drive thru speed of service

Reach business goals with Delaget Coach

Time is the most precious thing you have. Make sure you’re not spending it hunting down spreadsheets.